Uma Klein · 21 October 2026
Mapping Energy Yield Variations Across Multi-Site Photovoltaic Networks in Variable Climates
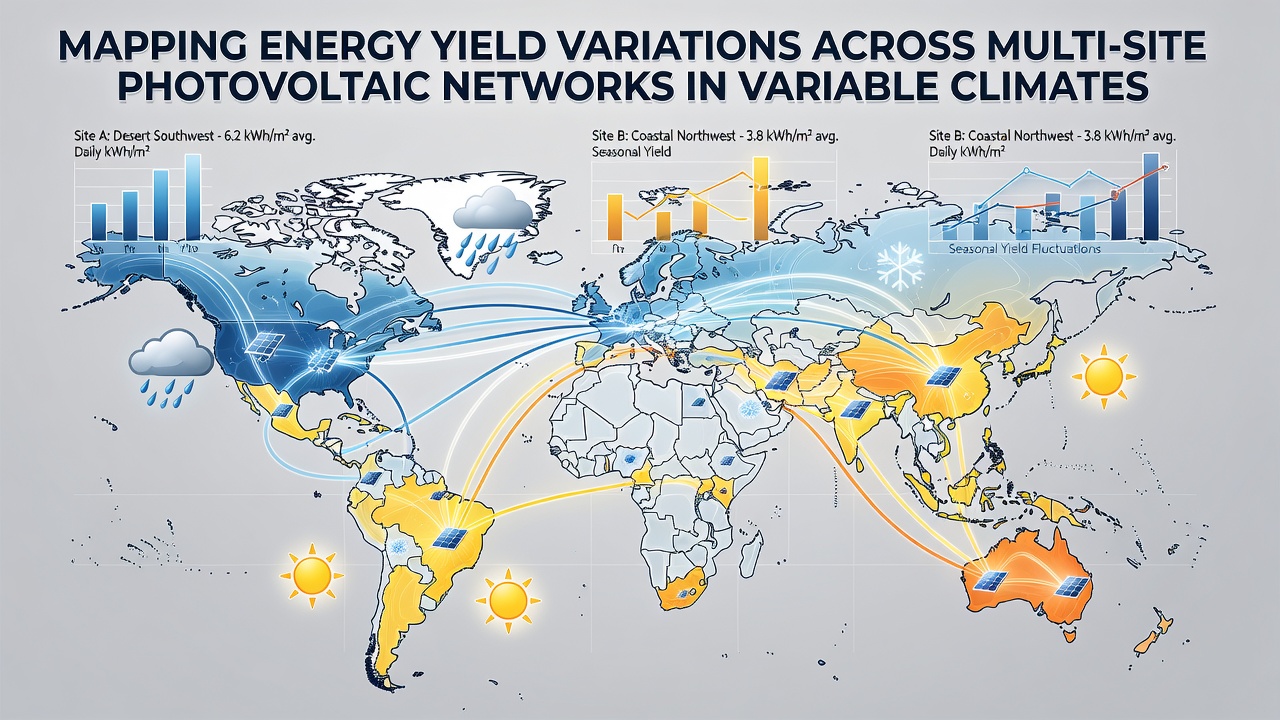
Multi-site photovoltaic networks require detailed mapping of energy yield variations because solar output depends on local irradiance levels, temperature swings, and seasonal weather patterns that shift from one region to another. Operators collect data from ground sensors, satellite imagery, and weather stations to build accurate models that predict performance across scattered arrays, and these models help identify sites where output falls short of expectations due to persistent cloud cover or extreme heat.
Researchers integrate irradiance measurements with performance ratio calculations to quantify how much energy each installation actually delivers compared with its theoretical maximum. Data sets from networks in desert environments show higher direct normal irradiance yet greater soiling losses, whereas coastal facilities experience more diffuse light and humidity-driven degradation; analysts combine these variables into geospatial layers so planners can compare yields side by side on a single dashboard.
Data Collection Methods and Sensor Networks
Ground-based pyranometers and reference cells provide high-resolution readings every minute, yet coverage gaps appear when sites sit hundreds of kilometers apart; satellite products from agencies such as NASA and the European Organisation for the Exploitation of Meteorological Satellites fill those gaps by supplying hourly global horizontal irradiance values at 5-kilometer resolution. Teams calibrate satellite estimates against local sensors, then apply machine-learning corrections that reduce root-mean-square errors to less than 5 percent in most tested regions.
Performance monitoring systems record inverter output, module temperature, and wind speed at each array; these streams feed into centralized databases where algorithms flag anomalies such as sudden drops that coincide with dust storms or prolonged rain. In October 2026 the Australian Renewable Energy Agency published updated guidelines that recommend minimum sensor density of one calibrated device per 50 megawatts of installed capacity, a standard already adopted by several large fleet operators.
Climate Variables and Yield Response Patterns
Temperature coefficients for crystalline silicon modules typically range between minus 0.35 and minus 0.45 percent per degree Celsius above 25 degrees, so sites in hot inland basins lose several percentage points of yield during summer afternoons while cooler highland installations maintain steadier output. Humidity influences soiling rates and corrosion, and researchers map these effects by overlaying Köppen climate classifications with historical production records.
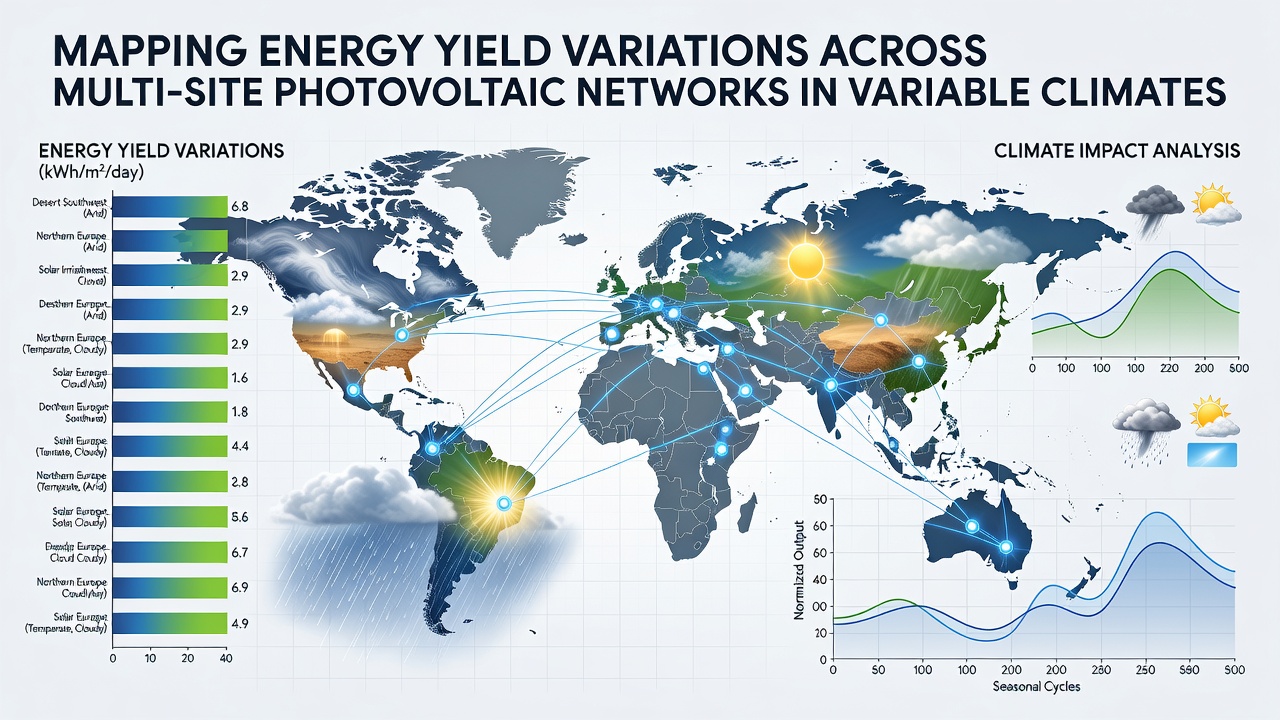
Variable cloud regimes create short-term fluctuations that accumulate into monthly differences; one study covering 12 sites across the southwestern United States and northern Mexico found that locations with frequent monsoon activity recorded 12 to 18 percent lower annual specific yield than arid control sites despite similar annual irradiance totals. Mapping tools display these deviations as color-coded heat maps that highlight clusters requiring additional cleaning cycles or tracker adjustments.
Geospatial Modeling and Predictive Analytics
Geographic information system platforms combine digital elevation models with atmospheric data to simulate shading from terrain and vegetation, then run Monte Carlo simulations that generate probability distributions of monthly energy production. These distributions allow operators to set site-specific performance baselines that account for climate variability rather than applying a single fleet-wide target.
According to a report issued by the National Renewable Energy Laboratory, combining satellite irradiance with reanalysis temperature data improves long-term yield forecasts by 7 to 11 percent compared with using ground measurements alone. Fleet managers apply the same layered approach to optimize cleaning schedules, schedule maintenance during low-production windows, and prioritize repowering decisions at underperforming locations.
Case Examples from Diverse Regions
Networks spanning the Atacama Desert, the Mediterranean coast, and the Canadian prairies illustrate how mapping reveals consistent patterns; desert arrays achieve high peak output but suffer dust-related losses that mapping software quantifies at 3 to 6 percent annually, while Mediterranean sites show pronounced winter-summer swings driven by changing solar angles and occasional Saharan dust intrusions. Prairie installations record strong summer performance tempered by snow cover and low winter irradiance, and operators use teh mapped data to justify bifacial module retrofits that capture albedo gains during snowy months.
European grid operators have begun publishing anonymized yield maps derived from transmission-level data, allowing researchers to validate models against real-world fleet statistics without disclosing proprietary site information. These public layers help developers site new capacity where existing networks already demonstrate stable yields under similar climate conditions.
Conclusion
Accurate mapping of energy yield variations supports better planning, maintenance, and investment decisions for multi-site photovoltaic networks operating across variable climates. Continued refinement of sensor networks, satellite products, and geospatial models will keep these tools aligned with expanding fleets and shifting weather patterns observed through 2026 and beyond.